 |
||
|
|
||
|
Page Title:
Intensity Forecasts From Surface Chart Data |
||
| |||||||||||||||
|
|
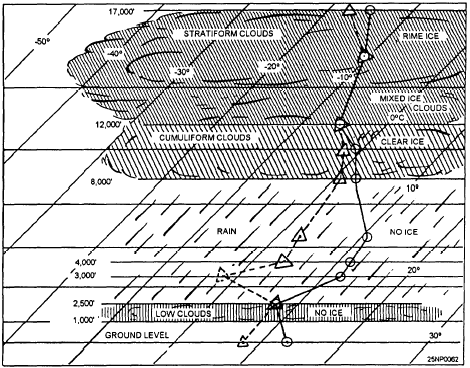
Click here to Order your Radar Equipment Online Intensity Forecasts From Surface Chart DataIf upper air data is not available, check the surface charts for locations of cloud shields associated with fronts, low-pressure centers, and precipitation areas along the route.Intensity Forecasts From Precipitation DataWithin clouds not resulting from frontal activity or orographic lifting, and over areas with steady nonfreezing precipitation, forecast little or no icing. Over areas not experiencing precipitation, but having cumuliform clouds, forecast moderate icing.Intensity Forecasts Based on Clouds Due To Frontal or Orographic LiftingWithin clouds resulting from frontal, or orographic lifting, neither the presence, nor the absence of precipitation can be used as indicators of icing. The following observations have proven to be accurate:. Within clouds up to 300 miles ahead of the warm front surface position, forecast moderate icing.. Within clouds up to 100 miles behind the cold front surface position, forecast severe icing.. Within clouds over a deep, almost low-pressure center, forecast severe icing. . In freezing drizzle, below or in clouds, severe icing. . In freezing rain, below or in clouds, severe icing. ICING TYPE FORECASTS The following rules apply to the forecasting of icing types: . Forecast rime icing when the temperatures at flight level are colder than 15C, or when between 1 and 15C in stable stratiform clouds. . Forecast clear icing when temperatures are between 0 and 8C in cumuliform clouds and freezing precipitation. . Forecast mixed rime and clear icing when temperatures are between 9 and 15C in cumuliform clouds. EXAMPLE OF ICING FORECASTS USING THE SKEW T LOG P DIAGRAMIt has been previously pointed out how the thickness of clouds, as well as the top of the overcast, may be estimated with accuracy from the dewpoint depression and changes in the lapse rate.The analysis of cloud type and icing type from the Skew T Log P Diagram is illustrated in figure 5-20. First, look at the general shape of the curve. The most prominent feature is the inversion, which shows a very stable layer between 2,500 and 3,000 feet. Note that the dewpoint depression is less than 1 degree at the base of the inversion. Moisture exists in a visible format this dewpoint depression, so expect a layer of broken or overcast clouds whose base will be approximately 2,000 feet and will be topped by the base of the inversion. The next most prominent feature is the high humidity, as reflected by the dewpoint depressions, at 8,000 feet.Since the dewpoint depression is 2C, a probability of clouds exists at this level. There is a rapid increase in the dewpoint depression at 17,000 feet, indicating that the top of the cloud layer is at this level. You would then assume the cloud layer existed between 8,000 and 17,000 feet.The next step is to determine, if possible, the type of clouds in between these levels. If this sounding were plotted on the Skew T Log P Diagram, you would be able to see that the slope of the lapse rate between 8,000 and 12,000 feet is shown to be unstable by comparison to the nearest moist adiabat. The clouds will then display unstable cumuliform characteristics. Above 12,000 feet, the lapse rate is shown by the same type of comparison to be stable, and the clouds there should be altostratus.Now determine the freezing level. Note that the lapse rate crosses the 0C temperature line at approximately 9,500 feet. Since you have determined that clouds exist at this level, the temperatures are between 0 and 8C, and the clouds are cumuliform, forecast clear ice in the unstable cloud up to 12,000 feet. Above 12,000 feet, the clouds are stratiform, so rime icing should be forecast. The intensity of the icing would have to be determined by the considerations given in the previous section of this chapter.Icing Forecasts Using the 8D Method When surface charts, upper air charts, synoptic and airway reports, and pilot reports are not clear as to the presence and possibility of icing, it may be determined
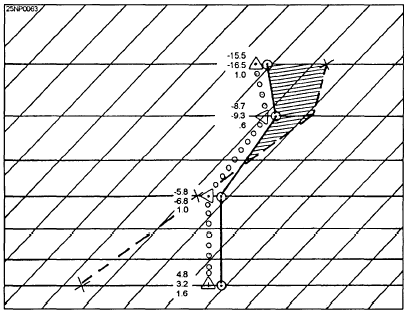
Figure 5-20.-An illustration of the analysis of cloud type and icing type from a Skew T Log P Diagram. from the Skew T Log P Diagram by using the following 7 steps: 1. Plot the temperature against pressure as determined from a RAOB sounding. 2. Record the temperature and dewpoint in degrees and tenths to the left of each plotted point. 3. Determine the difference (in degrees and tenths) between the temperature and dewpoint for each level. This difference is D, the dewpoint deficit; it is always taken to be positive. 4. Multiply D by 8 and plot the product (which is in degrees Celsius) opposite the corresponding temperature point at the appropriate place. 5. Connect the points plotted by step 4 with a dashed line in the manner illustrated in figure 5-21. 6. The icing layer is outlined by the area enclosed by the temperature curve on the left and the 8D curve on the right. In this outlined area, supersaturation with respect to ice exists. This is the hatched area, as shown in figure 5-21. 7. The intensity of icing is indicated by the size of the area enclosed by the temperature curve and the 8D curve. In addition, the factors given in the following section should be considered when formulating the icing forecast. The cloud type and the precipitation observed at the RAOB time or the forecast time maybe used to determine whether icing is rime or glaze. Conclusions arrived at by using the-SD method for forecasting icing: . When the temperature and dewpoint coincide in the RAOB sounding, the 8D curve must fall along the 0C isotherm. In a subfreezing layer, the air would be saturated with respect to water and supersaturated with respect to ice. Light rime icing would occur in the altostratus/nimbostratus clouds in such a region, and moderate rime icing would occur in cumulonimbus clouds in such a region. Severe clear ice would occur in the stratocumulus virga, cumulus virga, and stratus. . When the temperature and dewpoint do not coincide but the temperature curve lies to the left of the 8D curve in the subfreezing layer, the layer is supersaturated with respect to cloud droplets. If the clouds in this layer are altostratus, altocumulus, cumulogenitus, or altocumulus virga, only light rime will be encountered. If the clouds are cirrus, cirrocumulus, or cirrostratus, only light hoarfrost will be sublimated on the aircraft. In cloudless regions, there
Figure 5-21.-The 8D ice forecast method. will be no supercooled droplets, but hoarfrost will form on the aircraft through direct sublimation of water vapor. . When the temperature curve lies to the right of the 8D curve in a subfreezing layer, the layer is subsaturated with respect to both ice and water surface. No icing will occur in this region. This information is now available on CD in Adobe PDF Printable Format |
|
Privacy Statement - Press Release - Copyright Information. - Contact Us - Support Integrated Publishing |