Custom Search
|
|
  |
|
|
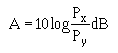
LABORATORY MEASUREMENTS Providing a complete description of every laboratory measurement performed by manufacturers and end users is impossible. This chapter only provides descriptions of optical fiber and optical connection measurements that are important to system operation. The list of optical fiber and optical connection laboratory measurements described in this chapter includes the following: End users routinely perform optical fiber measurements to measure fiber power loss and fiber information capacity. End users may also perform optical fiber measurements to measure fiber geometrical properties. Optical fiber power loss measurements include attenuation and cutoff wavelength. Optical fiber information capacity measurements include chromatic dispersion and bandwidth. Fiber geometrical measurements include cladding diameter, core diameter, numerical aperture, and mode field diameter. Optical connection measurements performed by end users in the laboratory include insertion loss and reflectance or return loss. Q.1 List the fiber geometrical measurements performed in the laboratory. Attenuation Attenuation is the loss of optical power as light travels along the fiber. It is a result of absorption, scattering, bending, and other loss mechanisms as described in chapter 3. Each loss mechanism contributes to the total amount of fiber attenuation. End users measure the total attenuation of a fiber at the operating wavelength (λ). The total attenuation (A) between an arbitrary point X and point Y located on the fiber is
Px is the power output at point X. P y is the power output at point Y. Point X is assumed to be closer to the optical source than point Y. The total amount of attenuation will vary with changes in wavelength λ. The attenuation coefficient (α) or attenuation rate, is
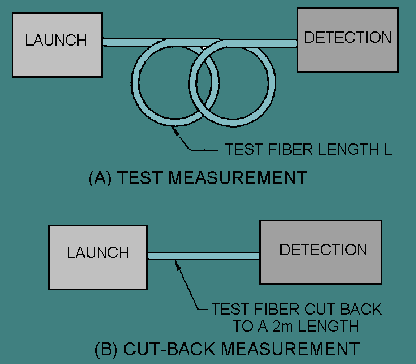
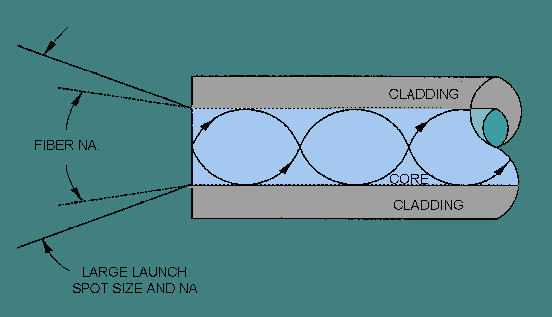
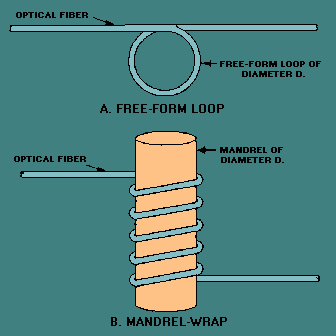
L is the distance between points X and Y. α is a positive number because Px is always larger than Py. The attenuation coefficient will also vary with changes in λ. CUTBACK METHOD. - In laboratory situations, end users perform the cutback method for measuring the total attenuation of an optical fiber. The cutback method involves comparing the optical power transmitted through a long piece of test fiber to the power present at the beginning of the fiber. The cutback method for measuring multimode fiber attenuation is EIA/TIA-455-46. The cutback method for measuring single mode fiber attenuation is EIA/TIA-455-78. The basic measurement process is the same for both of these procedures. The test method requires that the test fiber of known length (L) be cut back to an approximate 2-m length. This cut back causes the destruction of 2-m of fiber. This method requires access to both fiber ends. Each fiber end should be properly prepared to make measurements. EIA/TIA-455-57 describes how to properly prepare fiber ends for measurement purposes. Figure 5-1 illustrates the cutback method for measuring fiber attenuation. The cutback method begins by measuring, with an optical power meter, the output power P1 of the test fiber of known length (L) (figure 5-1, view A). Without disturbing the input light conditions, the test fiber is cut back to an approximate 2-m length. The output power P2 of the shortened test fiber is then measured (figure 5-1, view B). The fiber attenuation AT and the attenuation coefficient α are then calculated. Figure 5-1. - Cutback method for measuring fiber attenuation: A. Test measurement; B. Cut-back measurement. LAUNCH CONDITIONS. - Measurement personnel must pay attention to how optical power is launched into the fiber when measuring fiber attenuation. Different distributions of launch power (launch conditions) can result in different attenuation measurements. This is more of a problem with multimode fiber than single mode fiber. For single mode fiber, optical power must be launched only into the fundamental mode. This is accomplished using a mode filter on the fiber. For multimode fiber, the distribution of power among the modes of the fiber must be controlled. This is accomplished by controlling the launch spot size and angular distribution. The launch spot size is the area of the fiber face illuminated by the light beam from the optical source. The diameter of the spot depends on the size of the optical source and the properties of the optical elements (lenses, and so on) between the source and the fiber end face. The angular distribution is the angular extent of the light beam from the optical source incident on the fiber end face. The launch angular distribution also depends on the size of the optical source and the properties of the optical elements between the optical source and the fiber end face. Multimode optical fiber launch conditions are typically characterized as being underfilled or overfilled. An underfilled launch concentrates most of the optical power in the center of the fiber. An underfilled launch results when the launch spot size and angular distribution are smaller than that of the fiber core. Underfilling the fiber excites mainly low-order modes. Figure 5-2 illustrates an underfilled launch condition. Figure 5-2. - Underfilled launch condition. Overfilling the fiber excites both low-order and high-order modes. Figure 5-3 illustrates an overfilled launch condition. An overfilled launch condition occurs when the launch spot size and angular distribution are larger than that of the fiber core. Incident light that falls outside the fiber core is lost. In addition, light that is incident at angles greater than the angle of acceptance of the fiber core is lost. Figure 5-3. - Overfilled launch condition. In attenuation measurements, cladding-mode strippers and mode filters eliminate the effects that high-order modes have on attenuation results. A cladding-mode stripper is a device that removes any cladding mode power from the fiber. Most cladding-mode strippers consist of a material with a refractive index greater than that of the fiber cladding. For most fibers, the fiber coating acts as an excellent cladding-mode stripper. A mode filter is a device that attenuates specific modes propagating in the core of an optical fiber. Mode filters generally involve wrapping the test fiber around a mandrel. For multimode, tight bends tend to remove high-order modes from the fiber. This type of mode filter is known as a mandrel wrap mode filter. For multimode fibers, mode filters remove high-order propagating modes and are individually tailored and adjusted for a specific fiber type. For single mode fibers, a mode filter is used to eliminate the second-order mode from propagating along the fiber. The propagation of the second-order mode will affect attenuation measurements. Fiber attenuation caused by the second-order mode depends on the operating wavelength, the fiber bend radius and length. The two most common types of mode filters are free-form loops and mandrel wraps. Figure 5-4 illustrates the free-form loop and mandrel-wrap types of mode filters. Mandrel wraps for multimode fibers consist of several wraps (approximately 4 or 5) around a mandrel. A 20-mm diameter mandrel is typically used for 62.5 μm fiber. Mandrel wraps for single mode fibers consist of a single wrap around a 30-mm diameter mandrel. Another common mode filter for single mode fibers is a 30-mm diameter circular free-form loop. Additional information on multimode and single mode filters (and launch conditions) is available in EIA/TIA-455-50 and EIA/TIA-455-77, respectively. Figure 5-4. - Types of mode filters: A. Free-form loop; B. Mandrel-wrap.
Launch conditions significantly affect the results of multimode fiber attenuation measurements. If the fiber is underfilled, high-order-mode power loss has minimal effect on the measurement results. If too much power is launched into high-order modes, the high-order-mode power loss will dominate the attenuation results. Generally, fiber attenuation measurements are performed using an underfilled launch condition. Power in high-order modes is eliminated by either controlling the input spot size and angular distribution or using mode filters to remove high-order mode power. Q.2 End users measure the total attenuation of a fiber at the operating wavelength
(λ). Write the equation for total attenuation (A), between an arbitrary point X
and point Y located on an optical fiber. |
 |
|
|
Integrated Publishing, Inc. - A (SDVOSB) Service Disabled Veteran Owned Small Business
|