Custom Search
|
|
 
|
||
|
These
data are then plotted on 10 10 lines per inch graph paper as shown on the
examples (figures 2-8 through 2-15). For convenience, the first points are
located at zero time for an engine that has just been overhauled or at the
number of hours on the engine since the last overhaul (0, 400, 1000, 1600
hours, etc.). The first point for lube oil consumption occurs at 200 engine
hours. This is done because it is easier to start with a full engine sump and
monitor the amount of oil added each 200 hours to obtain the consumption rate.
Once the initial points have been plotted, all that is required is to record
and plot the same information each 200 hours and observe the trends that
develop. (NOTE: remember to always take data under the same controlled
conditions!) A close look at the sample graphs will reveal how they can be used
to determine engine condition. For purposes of illustration, the ideal trend of
each graphed value is shown for a hypothetical engine. Unfortunately, the Navy
does not have too many ideal engines so some samples of problem indications
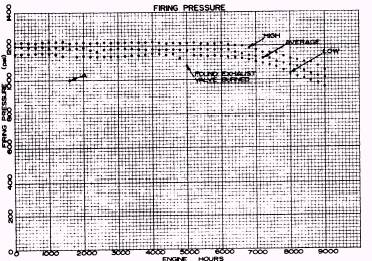
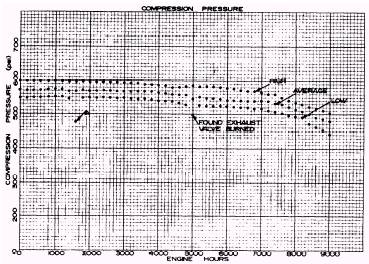
that may be expected are also included. On figures 2-8 and 2-9, a high, average, and low value is plotted for both firing and compression pressures. Under normal conditions these curves will remain flat until the engine is approaching the time of overhaul, then the curves will start to fall off. The high and low firing pressures will remain at about 50 psi (100 psi spread) from the average firing pressure for a well-balanced engine. If you look at figure 2-8 you can see that a decided drop in firing pressure has occurred at 1600 hours (point A). This failure in the compressing pressures indicates that the rings are either sticking, broken, or beginning to wear; that the valves are not functioning properly; or that the liner is beginning to score or possibly that a piston has cracked. Remember that any change in a curve (beyond normal limits) indicates that immediate attention is required. At this point, it should be pointed out that more than one indicator will usually reveal the same distress signal. Therefore, before any corrective action is taken, it is best to make a study of other curves to deny or confirm the problem. In this case check the lube oil consumption, crankcase vacuum, and exhaust temperature curves. In figures 2-9, 2-10, and 2-15 the typical indications for this problem
Figure 2-8. Firing Pressure Graph.
Figure 2-9.Compression Pressure Graph.
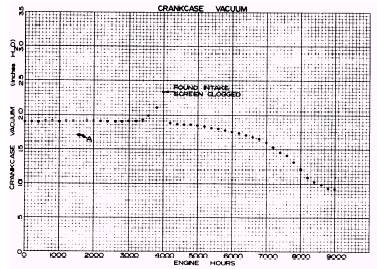
Figure 2-10.Crankcase Vacuum Graph.
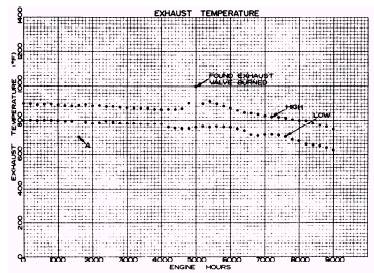
Figure 2-11.Exhaust Temperature Graph.
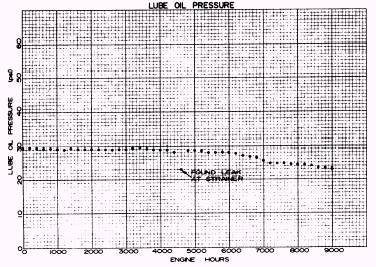
Figure 2-12.Lube Oil Pressure Graph.
Figure 2-13.Scavenging Pressure Graph.
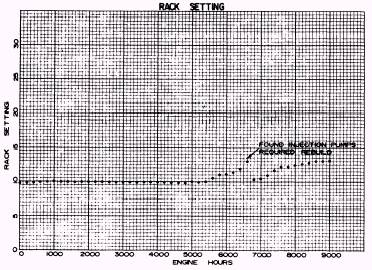
Figure 2-14.Rack Setting Graph.
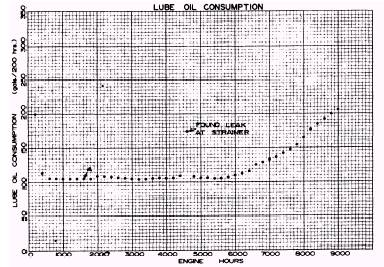
Figure 2-15.Lube Oil Consumption Graph. are marked as point A. All indications point to a definite internal problem in one cylinder. No rise in lube oil consumption is indicated (point A on figure 2-15) because a slightly worn set of rings or liner probably would not cause a measurable increase in lube oil consumption. The logs should now be consulted to find the problem cylinder and initiate appropriate repairs. If only firing pressures and exhaust temperature are low, the fuel system should be checked on the problem cylinder. The crankcase vacuum graph (figure 2-10) indicates ring, piston, or liner condition. As long as everything is normal, this curve will also be flat. A cracked piston, worn rings, or liner will increase blow-by, causing decreased crankcase vacuum. If crankcase vacuum decreases with no change in other indicators, the crankcase scavenging system should be checked for proper operation. An increase in crankcase vacuum may be caused by a clogged intake screen. The exhaust temperature graph (figure 2-11) indicates general cylinder conditions and engine balance, although this item is not necessarily a definite indication of trouble itself. Any abnor-mal temperature with no accompanying change in the various other indicators can usually be attributed to a faulty pyrometer. The pyrometer in question should then be carefully inspected and tested before any other inspections or adjustments are accomplished. The lube oil pressure graph (figure 2-12) indicates the engine bearing condition, lube oil pump condition, piping conditions, by-pass relief valve conditions, etc. Lube oil pressure obtained at the upper header of Fairbanks Morse opposed piston engines is particularly useful in monitoring the condition of the internal portion of the lube oil system. The manifold pressure graph (figure 2-13) indicates the condition of the scavenging system. Increasing air box pressures indicate port clogging, while reduced air box pressures indicate some abnormality in the air intake systems, blower, or turbocharger. Both of these cases re-quire immediate attention. The fuel rack or governor power piston position graph (figure 2-14) indicates the general condition of the fuel system. Increased rack settings for a given power output indicate fuel pump deterioration or a decrease in engine combustion efficiency. The lubrication oil consumption graph (figure 2-15) is for the lubricating oil consumption in gallons per 200 hours operation. It should be noted that the values on this curve are initially very high. They decrease and then remain nearly constant until the engine is approaching its overhaul time. The initial high consumption is due to unseated piston rings. As rings become seated, the consumption will decrease to a normal value and remain nearly constant until the rings or liners begin to wear. Any significant increase in lube oil consumption must be carefully evaluated to deter-mine if the oil is really being consumed in the engine or is being lost because of external leaks. Too many times an engine is assumed to be at fault when lube oil is really being lost due to leakage. Review of figures 2-8 through 2-15 will also indicate other problems that are not discussed in this text. Each sample problem is marked on the various graphs at the appropriate engine hours so a study of the samples can be made. In conclusion, operational graphs show the condition of the engine. They show what is happening, what needs to be done, and what has to be planned for in advance. The life expectancy of vital parts can be determined from these curves, and the parts can be renewed before they reach the point of failure. The trend analysis program must be followed closely, especially during the initial period of the program when care must be taken to ensure that the data gathered are meaningful. However, if the condition of any particular engine indicates that an overhaul is required to maintain it operational, this should be accomplished at the earliest possible time. |
 |
|
|
||