Custom Search
|
|
  |
|||||||||||||||||||||||||||||||||||||||||||||||||||||||||||||||||||||||||||||||||||||||||||||||||||||||||||||||||||||||||||||||||
|
SWR METERS The Hewlett-Packard Model 415E swr meter, shown in figure 4-3, is a commonly used swr meter. It is extremely accurate, sensitive, lightweight, easy to use, and portable. It is essentially a high-gain, tuned audio amplifier with a square-law meter that is calibrated to read swr directly. The meter is designed to be operated at a mean center frequency of 1,000 hertz. Figure 4-3. - Typical swr meter.
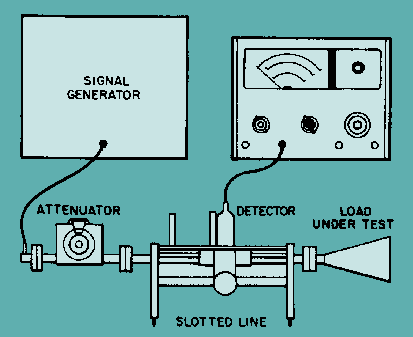
Figure 4-4 shows a typical swr measurement setup using the swr meter. The signal source is usually a sinusoidal wave that is square-wave modulated at 1,000 hertz. Figure 4-4. - Typical setup for measuring swr.
The swr meter usually gets its input from a detector, either a barretter or a crystal diode. This detector must be a square-law device (its output voltage is proportional to the applied rf power) to ensure the accuracy of the meter. The input is amplified and applied directly to the meter. To perform the measurement as shown in figure 4-4, you move the detector along the slotted line so that its probe is at a voltage maximum and adjust the gain of the meter with the RANGE-DB, GAIN, and VERNIER controls (EXPAND switch to NORM) for full-scale deflection (1.0 on the 1.0 to 4 SWR scale). Then move the probe toward a minimum. If the meter drops below 3.2, rotate the RANGE-DB switch one position clockwise and read on the 3.2 to 10 SWR scale. If the pointer drops below this scale, rotate the RANGE-DB switch one more position clockwise and read on the 1.0 to 4 scale and multiply by 10. This pattern continues for still higher swr readings. The dB scales can be used for a standing-wave-ratio measurement by setting the meter to full scale at a voltage maximum, then turning the RANGE-DB switch clockwise for an on-scale reading at a voltage minimum and noting the difference in dB reading at the maximum and minimum. A dB reading is obtained by adding the RANGE-DB switch setting and meter indication. The swr meter may also be used for high resolution insertion loss measurements. The setup for performing insertion loss or attenuation measurements is shown in figure 4-5. It requires that you initially establish a convenient reference on the DB scale of the meter. This is accomplished by connecting the signal source directly to the detector and using the GAIN and VERNIER controls to adjust the meter pointer to a convenient reference. Then you can insert the device to be measured between the signal source and the detector and note the change in dB, as shown on the meter. Figure 4-5. - Typical setup for measuring attenuation or insertion loss.
ATTENUATION AND INSERTION LOSS MEASUREMENTS OF TRANSMISSION LINES Transmission lines are sometimes subjected to extremes of weather and the corrosive effects of salt water. You should be aware of the adverse effects of this environment on transmission lines and how to determine electrical losses caused by transmission-line deterioration. Q.3 What are the two common causes of transmission-line deterioration? LOSS MEASUREMENT Insertion loss measurement of transmission lines requires the use of a good signal generator and an accurate power meter. The method is identical to the insertion loss measurements used on most couplers. When a known frequency, at a predetermined level of power, is inserted into one end of a transmission line, then the same frequency and the same level of power should be transmitted to the other end of a transmission line. Because all transmission lines contain some degree of resistance, some loss of power will occur during the test. Exposure to the elements over a period of time causes transmission-line deterioration. To determine the accuracy of this test, you should use the power meter to measure the output of the signal generator at the end of the test cable to be attached to the transmission line. Any power loss associated with the test cables should be recorded and subtracted from the measurement taken with the transmission line connected. You should note that transmission lines, like all other electronic components, are designed to operate over a specific range of frequencies. It is not uncommon for a transmission line to operate improperly at one frequency, yet operate properly over the remainder of its frequency spectrum. You should check transmission-line losses over their entire frequency range. Insertion loss measurements are normally taken when a system is first installed or the transmission line is replaced. Periodic measurements should be performed to enable you to determine if system performance is being degraded by transmission-line deterioration. Q.4 Is it possible for a transmission line to operate improperly at certain frequencies
and properly at others? TRANSMISSION-LINE FORMULAS Transmission lines are engineered and manufactured to meet certain specifications. The most important of these specifications relates to frequency, power-handling capabilities, and characteristic impedance. The dielectric constant (K) of the insulating material is probably the manufacturer's most important consideration and is the primary factor that affects the size of the coaxial cable. The formulas in the following sections discuss some aspects of coaxial transmission-line engineering. A cross section of a coaxial line is shown in figure 4-6. The characteristic impedance of a coaxial line can be determined by the following formula:
Figure 4-6. - Coaxial line.
Table 4-1. - Dielectric Constants of Materials
Attenuation in a coaxial line in terms of decibels per foot can be determined by the following formula:
As a technician, you need not be concerned with designing coaxial transmission lines. It is, however, our feeling that you should be familiar with the parameters that go into making a transmission line. It can readily be seen by the above formulas that transmission lines cannot be randomly selected without consideration of system requirements. NAVSHIPS 0967-000-0140, EIMB, Reference Data, section 3, lists the characteristics of most common transmission lines. Q.5 What factor has the greatest effect on the physical size of a coaxial cable? |
|||||||||||||||||||||||||||||||||||||||||||||||||||||||||||||||||||||||||||||||||||||||||||||||||||||||||||||||||||||||||||||||||
|
|
Integrated Publishing, Inc. - A (SDVOSB) Service Disabled Veteran Owned Small Business
|