Custom Search
|
|
  |
|
|
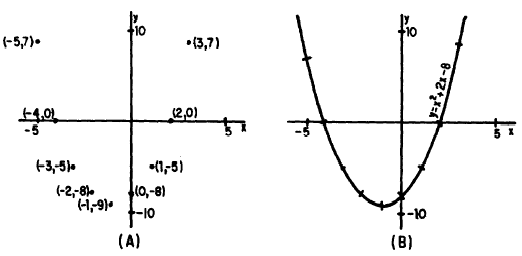
GRAPHICAL SOLUTION A fourth method of solving a quadratic equation is by means of graphing. In graphing linear equations using both axes as reference, we recall that an independent variable, x, and a dependent variable, y, were needed. The coordinates of points on the graph of the equation were designated (x, y).Since the quadratics we are considering contain only one variable, as in the equation x2 - 8x + 12 = 0 we cannot plot values for the equations in the present form using both x and y axes. A dependent variable, y, is necessary.If we think of the expression x2 - 8x + 12 as a function, then this function can be considered to have many possible numerical values, depending on what value we assign to x. The particular value or values of x which cause the value of the function to be 0 are solutions for the equationx2 - 8x + 12 = 0 For convenience, we may choose to let y represent the functionX2 - 8x + 12 If numerical values are now assigned to x, the corresponding values of y may be calculated. When these pairs of corresponding values of x and y are tabulated, the resulting table provides the information necessary for plotting a graph of the function.EXAMPLE: Graph the equation x2 + 2x - 8 = 0 and from the graph write the roots of the equation. SOLUTION: 1. Let y = x2 + 2x - 8. 2. Make a table of the y values corresponding to the value assigned x, as shown in table 16-1.Table 16-1.-Tabulation of x and y values for the function y = x2 + 2x - 8.
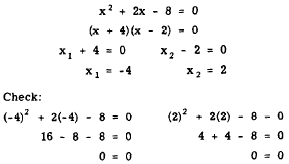
3. Plot the pairs of x and y values that appear in the table as coordinates of points on a rectangular coordinate system as in figure 16-1 (A). 4. Draw a smooth curve through these points, as shown in figure 16-1 (B). Notice that this curve crosses the X axis in two places. We also recall that, for any point on the X axis, the y coordinate is zero. Thus, in the figure we see that when y is zero, x is -4 or +2. When y is zero, furthermore, we have the original equation,
Figure 16-1.-Graph of the equation y = x2 + 2x - 8. (A) Points plotted; (B) curve drawn through plotted points. x2 + 2x - 8 = 0 Thus, the values of x at these points where the graph of the equation crosses the X axis (x = -4 or +2) are solutions to the original equation. We may check these results by solving the equation algebraically. Thus,
The curve in figure 16-1 (B) is called a PARABOLA. Every quadratic of the form ax2 + bx + c = y will have a graph of this general shape. The curve will open downward if a is negative, and upward if a is positive. Graphing provides a fourth method of finding the roots of a quadratic in one variable. When the equation is graphed, the roots will be the X intercepts (those values of x where the curve crosses the X axis). The X intercepts are the points at which y is 0. Practice problems. Graph the following quadratic equations and read the roots of each equation from its graph 1. x2 - 4x - 8 = 0 Answers: 1. See figure 16-2. x = 5.5; x = -1.5 |
 
|