
TM 11-6625-255-14/TO 33A1-13-170-1
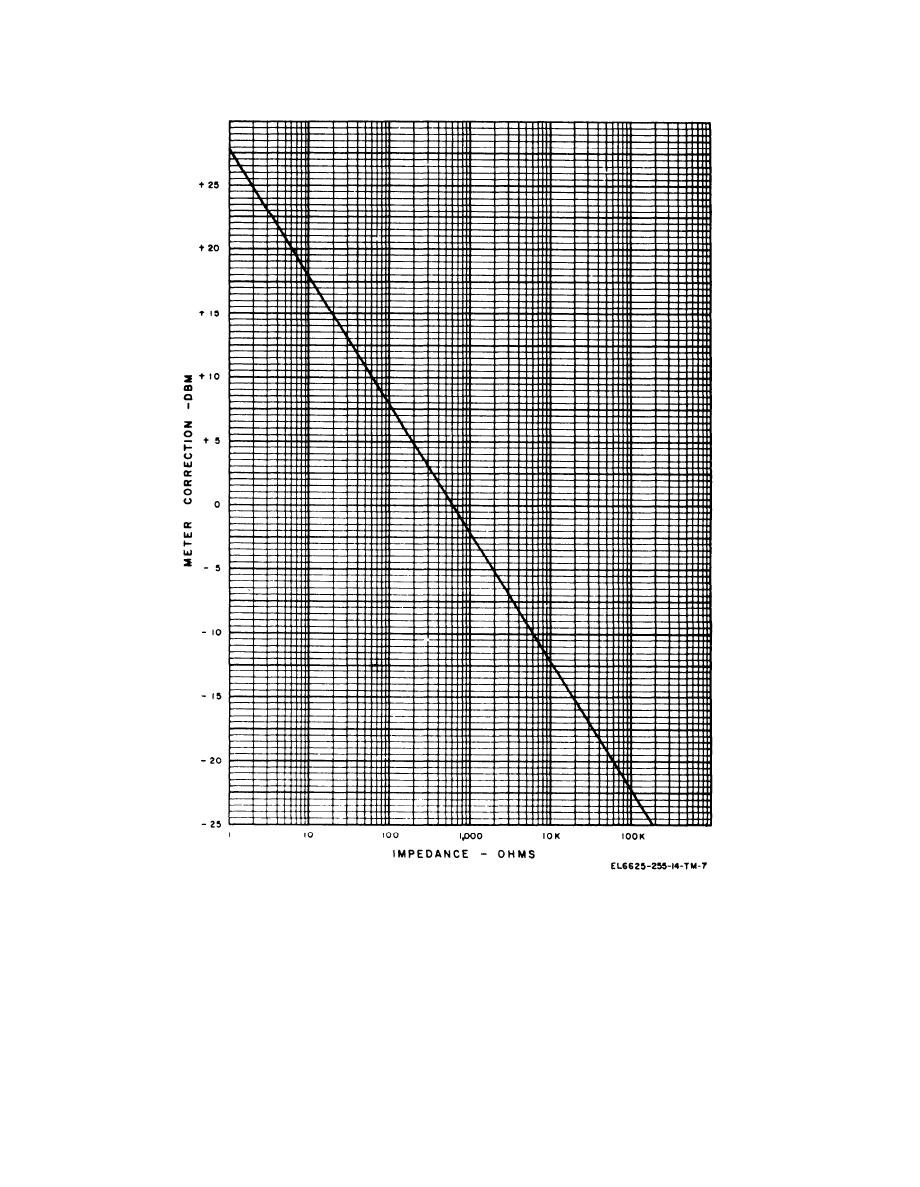
Figure 3-4. Impedance correction chart.
310. Use as Vtvm With Increased Sen-
sitivity of the spectrum analyzer is increased by a
sitivity
voltage gain of 100, or by a dB gain of 40.
When the function switch is set to SET LEVEL,
a. Connect test leads from the signal source to
the sensitivity of the spectrum analyzer is in-
be measured to the AF INPUT binding posts.
creased by a voltage gain of 10, or by a dB gain of
b. Set t h e AF-RF selector switch (TS-
+20. When this switch is set to NOISE, the sen-
723A/U) to AF.
3-6

