Custom Search
|
|
  |
|
|
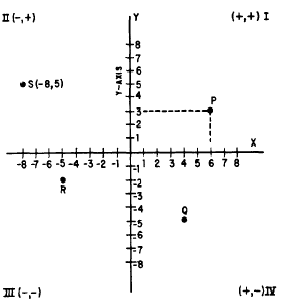
CHAPTER 12 IN TWO VARIABLESThus far in this course, discussions of equations have been limited to linear equations in one variable. Linear equations which have two variables are common, and their solution involves extending some of the procedures which have already been introduced. RECTANGULAR COORDINATES An outstanding characteristic of equations in two variables is their adaptability to graphical analysis. The rectangular coordinate system, which was introduced in chapter 3 of this course, is used in analyzing equations graphically. This system of vertical and horizontal lines, meeting each other at right angles and thus forming a rectangular grid, is often called the Cartesian coordinate system. It is named after the French philosopher and mathematician, Rene Descartes, who invented it. COORDINATE AXES The rectangular coordinate system is developed on a framework of reference similar to figure 3-2 in chapter 3 of this course. On a piece of graph paper, two lines are drawn intersecting each other at right angles, as in figure 12-1. The vertical line is usually labeled with the capital letter Y and called the Y axis. The horizontal line is usually labeled with the capital letter X and called the X axis. The point where the X and Y axes intersect is called the ORIGIN and is labeled with the letter o. Above the origin, numbers measured along or parallel to the Y axis are positive; below the origin they are negative. To the right of the origin, numbers measured along or parallel to the X axis are positive; to the left they are negative. COORDINATES A point anywhere on the graph may be located by two numbers, one showing the distance of the point from the Y axis, and the other showing the distance of the point from the X axis.
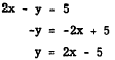
Figure 12-1 -Rectangular coordinate system. Point P (fig. 12-1) is 6 units to the right of the Y axis and 3 units above the X axis. We call the numbers that indicate the position of a point COORDINATES. The number indicating the distance of the point measured horizontally from the origin is the X coordinate (6 in this example), and the number indicating the distance of the point measured vertically from the origin (3 in this example) is the Y coordinate. In describing the location of a point by means of rectangular coordinates, it is customary to place the coordinates within parentheses and separate them with a comma. The X coordinate is always written first. The coordinates of point P (fig. 12-1) are written (6, 3). The coordinates for point Q are (4, -5); for point R, they are (-5, -2); and for point S, they are (-8, 5). Usually when we indicate a point on a graph, we write a letter and the coordinates of the point. Thus, in figure 12-1, for point S, we write S(-8, 5). The other points would ordinarily be written, P(6, 3), Q(4, -5), and R(-5, -2). The Y coordinate of a point is often called its ORDINATE and the X coordinate is often called its ABSCISSA. QUADRANTS The X and Y axes divide the graph into four parts called QUADRANTS. In figure 12-1, point P is in quadrant I, point S is in quadrant II, R is in quadrant III, and Q is in quadrant IV. In the first and fourth quadrants, the X coordinate is positive, because it is to the right of the origin. In the second and third quadrant it is negative, because it is to the left of the origin. Likewise, the Y coordinate is positive in the first and second quadrants, being above the origin; it is negative in the third and fourth quadrants, being below the origin. Thus, we know in advance the signs of the coordinates of a point by knowing the quadrant in which the point appears. The signs of the coordinates in the four quadrants are shown in figure 12-1. Locating points with respect to axes is called PLOTTING. As shown with point P (fig. 12-l), plotting a point is equivalent to completing a rectangle that has segments of the axes as two of its sides with lines dropped perpendicularly to the axes forming the other two sides. This is the reason for the name "rectangular coordinates." PLOTTING A LINEAR EQUATION A linear equation in two variables may have many solutions. For example, in solving the equation 2x - y = 5, we can find an unlimited number of values of x for which there will be a corresponding value of y. When x is 4, y is 3, since (2 x 4) - 3 = 5. When x is 3, y is 1, and when x is 6, y is 7. When we graph an equation, these pairs of values are considered coordinates of points on the graph. The graph of an equation is nothing more than a line joining the points located by the various pairs of numbers that satisfy the equation. To picture an equation, we first find several pairs of values that satisfy the equation. For example, for the equation 2x - y = 5, we assign several values to x and solve for y. A convenient way to find values is to first solve the equation for either variable, as follows:
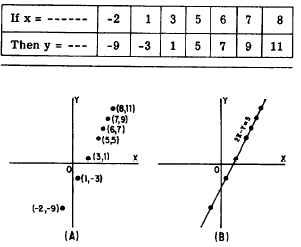
Once this is accomplished, the value of y is readily apparent when values are substituted for x. The information derived may be recorded in a table such as table 12-1. We then lay off X and Y axes on graph paper, select some convenient unit distance for measurement along the axes, and then plot the pairs of values found for x and y as coordinates of points on the graph. Thus, we locate the pairs of values shown in table 12-1 on a graph, as shown in figure 12-2 (A). Table 12-1.-Values of x and y in the equation
Figure 12-2.-Graph of 2x - y = 5. Finally, we draw a line joining these points, as in figure 12-2 (B). It is seen that this is a straight line; hence the name "linear equation." Once the graph is drawn, it is customary to write the equation it represents along the line, as shown in figure 12-2 (B). It can be shown that the graph of an equation is the geometric representation of all the points whose coordinates satisfy the conditions of the equation. The line represents an infinite number of pairs of coordinates for this equation. For example, selecting at random the point on the line where x is 2: and y is 0 and substituting these values in the equation, we find that they satisfy it. Thus,
If two points that lie on a straight line can be located, the position of the line is known. The mathematical language for this is "Two points DETERMINE a straight line." We now know that the graph of a linear equation in two variables is a straight line. Since two points are sufficient to determine a straight line, a linear equation can be graphed by plotting two points and drawing a straight line through these points. Very often pairs of whole numbers which satisfy the equation can be found by inspection. Such points are easily plotted. After the line is drawn through two points, it is well to plot a third point as a check. If this third point whose coordinates satisfy the equation lies on the line the graph is accurately drawn. |
 |