Custom Search
|
|
 
|
||
|
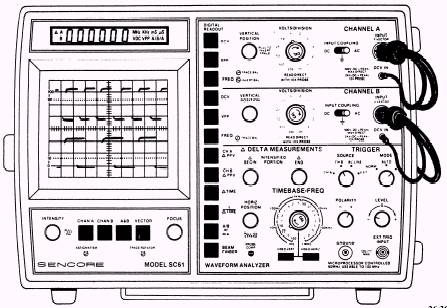
WAVEFORM ANALYSIS OF SOLID-STATE DEVICES Waveform analysis can be made by observing displays of voltage and current variations with respect to time or by harmonic analysis of complex signals. Waveform displays are particularly valuable for adjusting and testing pulsegenerating, pulse-forming, and pulse-amplifying circuits. The waveform visual display is also useful for determining signal distortion, phase shift, modulation factor, frequency, and peak-to-peak voltage. In this section, we will briefly discuss the instrument used to provide you with these visual interpretations of waveforms, the oscilloscope. DUAL-TRACE OSCILLOSCOPE The cathode-ray tube (CRT) oscilloscope (fig. 4-25) is commonly used for the analysis of
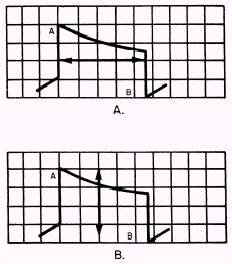
Figure 4-25.\Sencore SC61 waveform analyzer. waveforms generated by electronic equipment. Several types of cathode-ray oscilloscopes are available for making waveform analysis. The oscilloscope required for a particular test is determined by such characteristics as inputfrequency response, input impedance, sensitivity, sweep rate, and the methods of sweep control. The display observed on a cathode-ray oscilloscope is ordinarily one similar to those shown in figure 4-26. Views A and B show the instantaneous voltage of the wave plotted against time. Elapsed time is indicated by horizontal distance from left to right across the etched grid (graticule) placed over the face of the tube. The amplitude of the wave is measured vertically on the graph. The oscilloscope is also used to picture changes in quantities other than simply the voltages in electric circuits. For example, if you need to see the changes in waveform of electric current, you must first send the current through a small resistor. You can then use the oscilloscope to view the voltage wave across the resistor. Other quantities, such as temperatures, pressures, speeds, and accelerations, can be translated into voltages by means of suitable transducers and then viewed on the oscilloscope. The oscilloscope shown in figure 4-25 also has the capability to provide a digital readout of the
Figure 4-26.\Typical waveform displays. signal displayed on the CRT. This feature eliminates the need to count the grids on the screen and perform the mathematical calculations required to determine the magnitude of the waveform. There are two types of digital measurements made through the same probe used for the CRT display. The first three functions for each channel are called the Auto-Tracking tests. "Auto-Tracking" means the microcomputer automatically tracks the CRT display at all times. The three Auto-Tracking functions are measuring dc volts, peak-to-peak volts, and frequency. All three functions measure the entire waveform. The second group of digital tests are the delta tests, which let you measure part of a waveform. These tests measure the peak-to-peak amplitude, time, or frequency of any part of the waveform shown on the CRT. Both types of digital tests are unaffected by the vertical or horizontal verniers or position controls, allowing the CRT display to be any size you want without affecting the accuracy of the digital readout. All tests are automatically ranged or directly interfaced to the input attenuators for direct readings. One final test allows the frequency of the signal applied to channel A to be compared to the frequency of the signal applied to channel B. The digital display shows the ratio of the two frequencies to troubleshoot divider or multiplier stages. |
 |
|
|
||