|
||
|
|
||
| |||||||||||||||
|
|
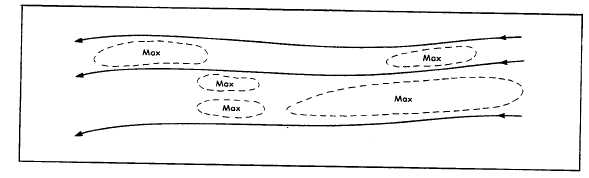
Click here to Order your Radar Equipment Online Isotach maxima and minima have preferred areas of occurrence within the streamline pattern. The maxima are usually found upstream from centers of confluent wind flow on either side of asymptotes. Maxima also tend to occur down-stream from the centers of streamline divergence on either side of asymptotes. See figure 9-2-14. In the trades, or any other major east-west current, elongated maxima are usually found near Figure 9-2-15.Isotach maxima in broad easterly flow; maxima usually
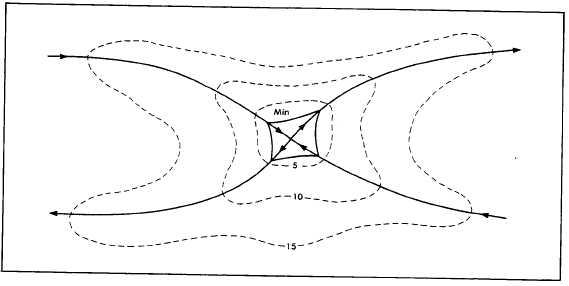
parallel streamlines and are sometimes found side the center of the current. Figure 9-2-15 shows that in very broad currents, two or more maxima may exist side by side. Isotach spacing reflects the strength of the wind; the higher the wind speed, the tighter the spacing. Isotach minima occur at all singular points and also along asymptotes. Around neutral points, they take on a saddle-like appearance away from the area of minimum winds. See figure 9-2-16. From the illustrations presented, you can see that isotachs kink when they cross stream-lines. With cyclonic circulations, they kink with the flow (in the same direction). With anticyclonic circulations, they kink against the flow. Figure 9-2-17 illustrates these two patterns. Before you finalize your analysis, look over your chart objectively and ask yourself the following questions: 1. Do the streamlines conform to the general flow pattern? 2. Have I justified throwing out every wind report that I could not draw to? 3. If I cannot justify discarding a wind report, is there any way I can draw to it? 4. Have I drawn the streamlines parallel to the plotted winds, rather than at an angle? 5. Is the chart consistent with other levels? 6. Is the chart consistent with history? 7. Are the streamlines and isotachs consistent? 8. Have I drawn any unnecessary lines?
|
|
Privacy Statement - Press Release - Copyright Information. - Contact Us - Support Integrated Publishing |