Custom Search
|
|
  |
|
|
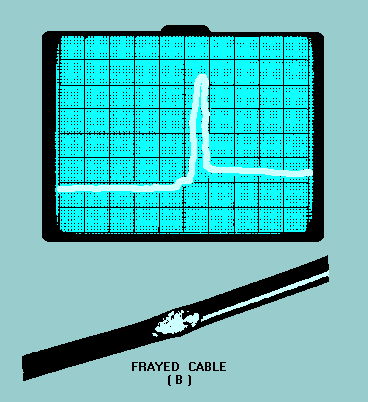
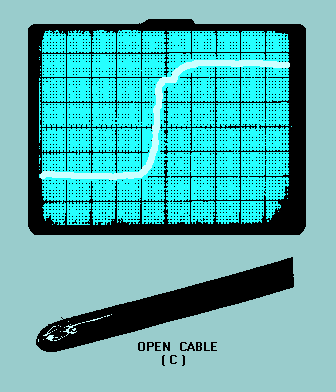
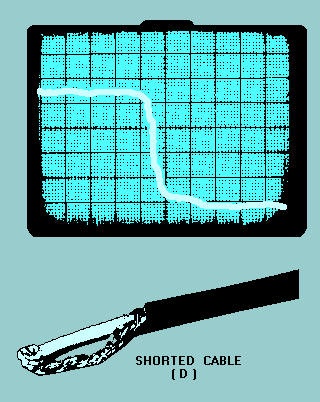
TIME-DOMAIN REFLECTOMETRY TIME-DOMAIN REFLECTOMETRY is a testing and measurement technique that has found increasing usefulness in testing transmission lines (both metallic and fiber-optic), cables, strip lines, connectors, and other wideband systems or components. Basically, time-domain reflectometry is an extension of an earlier technique in which reflections from an electrical pulse were monitored to locate faults and to determine the characteristics of power transmission lines. You can compare time-domain reflectometry to a closed-loop radar system in which the transmitted signal, a very fast step pulse, is fed into the system and the reflections resulting from discontinuities or impedance deviations in the system are monitored on a crt. The technique used in time-domain reflectometry consists of feeding an impulse of energy into the system and then observing that energy as it is reflected by the system at the point of insertion. When the fast-rise input pulse meets with a discontinuity or impedance mismatch, the resultant reflections appearing at the feed point are compared in phase, time, and amplitude with the original pulse. By analyzing the magnitude, deviation, and shape of the reflected waveform, you can determine the nature of the impedance variation in the transmission system. Also, since distance is related to time and the amplitude of the reflected step is directly related to impedance, the comparison indicates the distance to the fault as well as the nature of the fault. Figure 5-25, view A, view B, view C, and view D , illustrates typical transmission line problems that can easily be identified by using a time-domain reflectometer (tdr). In addition to showing both the distance to and the nature (resistive, inductive, or capacitive) of each line discontinuity, time-domain reflectometry also reveals the characteristic impedance of the line and indicates whether losses are shunt or series. They are also used to locate and analyze connectors and splices. Figure 5-25A. - Time-domain reflectometer display of transmission line problems.
Figure 5-25B. - Time-domain reflectometer display of transmission line problems.
Figure 5-25C. - Time-domain reflectometer display of transmission line problems.
Figure 5-25D. - Time-domain reflectometer display of transmission line problems.
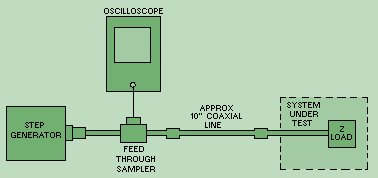
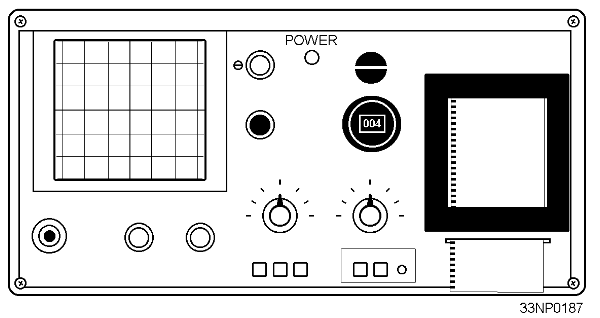
A conventional method of evaluating high-frequency transmission systems and components has been through the use of standing wave ratio (swr) measurements to obtain an overall indication of transmission line performance. This method involves feeding a sine-wave signal into the system and measuring the maximum and minimum amplitudes of the standing waves that result from system discontinuities or load mismatches. The ratio between the minimum and maximum swr values is then taken as the system FIGURE OF MERIT. The swr measurement, however, does not isolate individual discontinuities or mismatches when multiple reflections are present; it only indicates their total effect. Time-domain reflectometry measurements, on the other hand, isolate the line characteristics in time (location). As a result, multiple reflections resulting from more than one discontinuity or impedance variation that are separated in distance on the line are also separated in time at the monitoring point and can be individually analyzed. Prior to the advent of time-domain reflectometers, time-domain reflectometry was performed with the aid of sampling oscilloscopes and pulse generators with very fast rise times. Figure 5-26 shows the earlier type of test setup, which is still an option. However, today's time-domain reflectometers have several advantages over the old pulse-generator and oscilloscope methods. Modern time-domain reflectometers are compact, lightweight, are often supplied with battery pack options for field use, and provide a direct readout of distances instead of time. Some equipments provide a paper-tape recording for a permanent record. Figure 5-27 shows a typical time-domain reflectometer. Figure 5-26. - Time-domain reflectometry, basic equipment setup.
Figure 5-27. - Typical time-domain reflectometer.
Q.8 Why are time-domain reflectometers often compared to a radar system? |
 |