Custom Search
|
|
 
|
||
|
PLOTTING CROSS SECTIONS. Cross
sections are usually plotted on
cross-section paper, which comes
either in rolls or sheets. It is ruled into
1-in. squares with heavy, orange or green
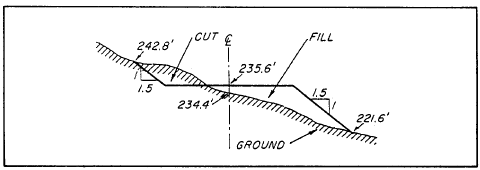
Figure 14-27.-Three-level section in fill.
Figure 14-28.-Sidehlll section. lines and with lighter lines into 1/10-in. squares, Cross-section paper is commonly called 10- x 10-in, paper.Plot each cross section separately; and below each plot, show the station number. Place the first cross section at the top of a sheet and continue downward until you plot all the sections. Two or more sections may be plotted on the same sheet. In a major highway project, plot cross sections on a continuous roll of cross-section paper. Some surveyors prefer to plot the cross sections from the bottom to the top of the paper. They may also prefer to record cross-section notes in the same manner. If you follow these methods of plotting and recording, you are properly oriented with the actual direction of the highway; that is, your left is also towards the left of the highway; it is also to the left of the cross-section notes and the plotted cross section. Really, it doesnt matter which method you follow as long as you are properly oriented to the direction of the highway at all times.Unlike profile plotting, in cross-section plotting, the same scale is often used for both the vertical and the horizontal distance. Common scales are 1 in. = 5 ft and 1 in. = 10 ft. When sections are shallow, it is best to exaggerate the vertical scale, making it from two to ten times the horizontal scale.For the center line for a row of sections, use one of the heavier vertical lines on the paper far enough away from the margin so that no points plotted will run outside the limits of the paper. Note the depths indicated for the first section to be plotted, and select a horizontal line for the base
Figure 14-29.-A. Cross section notes. B. Cross sections plotted. that is about centered between the top and bottom margins. Mark this with the base elevation. Then lay off the horizontal distances of the section surface elevations on either side of the center line, and plot the elevations by using the level data. |
||
|
||