Custom Search
|
|
 
|
||
|
For unstable isotopes the additional information includes the half life, the mode of decay (for example, R-, (c), the total disintegration energy in MeV (million electron volts), and the mass in amu when available. A typical block for an unstable nuclide from the Chart of the Nuclides is shown in Figure 5.
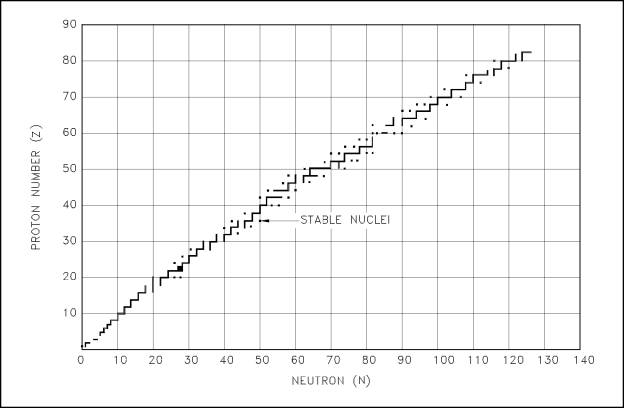
Figure 5 Unstable Nuclides Neutron - Proton Ratios Figure 6 shows the distribution of the stable nuclides plotted on the same axes as the Chart of the Nuclides. As the mass numbers become higher, the ratio of neutrons to protons in the nucleus becomes larger. For helium-4 (2 protons and 2 neutrons) and oxygen-16 (8 protons and 8 neutrons) this ratio is unity. For indium-115 (49 protons and 66 neutrons) the ratio of neutrons to protons has increased to 1.35, and for uranium-238 (92 protons and 146 neutrons) the neutronto-proton ratio is 1.59.
Figure 6 Neutron - Proton Plot of the Stable Nuclides If a heavy nucleus were to split into two fragments, each fragment would form a nucleus that would have approximately the same neutron-to-proton ratio as the heavy nucleus. This high neutron-to-proton ratio places the fragments below and to the right of the stability curve displayed by Figure 6. The instability caused by this excess of neutrons is generally rectified by successive beta emissions, each of which converts a neutron to a proton and moves the nucleus toward a more stable neutron-to-proton ratio. |
 
|
|
|
||
|
|
Integrated Publishing, Inc. - A (SDVOSB) Service Disabled Veteran Owned Small Business
|