Custom Search
|
|
 
|
||
|
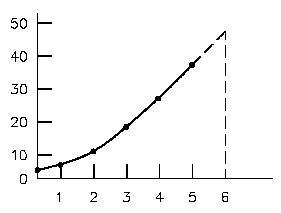
INTERPOLATION AND EXTRAPOLATION This chapter covers the use of interpolation and extrapolation to solve for unknowns on various types of graphs. EO1.17 Given a graph, SOLVE for the unknown using extrapolation. EO1.18 Given a graph, SOLVE for the unknown using interpolation. Definitions Interpolation Interpolation is the process of obtaining a value from a graph or table that is located between major points given, or between data points plotted. A ratio process is usually used to obtain the value. Extrapolation Extrapolation is the process of obtaining a value from a chart or graph that extends beyond the given data. The "trend" of the data is extended past the last point given and an estimate made of the value. Interpolation and Extrapolation Developing a curve from a set of data provides the student with the opportunity to interpolate between given data points. Using the curve in the following example, the value of the dependent variable at 4.5 can be estimated by interpolating on the curve between the two data points given, resulting in the value of 32. Note that the interpolation is the process of obtaining a value on the plotted graph that lies between two given data points. Extrapolation is the process in which information is gained from plotted data by extending the data curve beyond the points of given data (using the basic shape of the curve as a guide), and then estimating the value of a given point by using the extended (extrapolated) curve as the source. The above principles are illustrated in the example that follows. Example: Given equation y = x2 + 2x + 3: Plot the curve for x from 0 to 5. Extrapolate the curve and give the value of y at x = 6. Put 6 into the equation evaluating y, then compare the values. Interpolate the curve at x = 4.5. Put 4.5 into the equation evaluating y, then compare the values.
Extrapolating x = 6 gives a value of y = 48. Using the equation, the actual value of y is 51. Interpolating x = 4.5 gives a value of y = 32. Using the equation, the actual value of y is 32.25. Summary The important information in this chapter is summarized below. Interpolation and Extrapolation Summary Interpolation Interpolation is the process of obtaining a value from a graph or table that is located between major points given, or between data points plotted. A ratio process is usually used to obtain the value. Extrapolation Extrapolation is the process of obtaining a value from a chart or graph that extends beyond the given data. The "trend" of the data is extended past the last point given and an estimate made of the value.
|
 
|
|
|
||
|
|
Integrated Publishing, Inc. - A (SDVOSB) Service Disabled Veteran Owned Small Business
|