Custom Search
|
|
 
|
||
|
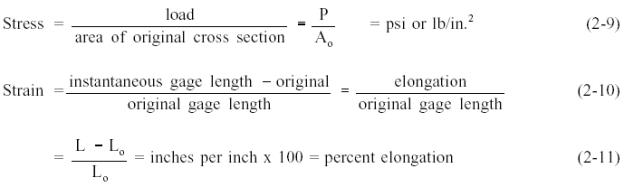
To determine the load-carrying ability and the amount of deformation before fracture, a sample of material is commonly tested by a Tensile Test. This test consists of applying a gradually increasing force of tension at one end of a sample length of the material. The other end is anchored in a rigid support so that the sample is slowly pulled apart. The testing machine is equipped with a device to indicate, and possibly record, the magnitude of the force throughout the test. Simultaneous measurements are made of the increasing length of a selected portion at the middle of the specimen, called the gage length. The measurements of both load and elongation are ordinarily discontinued shortly after plastic deformation begins; however, the maximum load reached is always recorded. Fracture point is the point where the material fractures due to plastic deformation. After the specimen has been pulled apart and removed from the machine, the fractured ends are fitted together and measurements are made of the nowextended gage length and of the average diameter of the minimum cross section. The average diameter of the minimum cross section is measured only if the specimen used is cylindrical. The tabulated results at the end of the test consist of the following. a. designation of the material under test b. original cross section dimensions of the specimen within the gage length c. original gage length d. a series of frequent readings identifying the load and the corresponding gage length dimension e. final average diameter of the minimum cross section f. final gage length g. description of the appearance of the fracture surfaces (for example, cup-cone, wolf s ear, diagonal, start) A graph of the results is made from the tabulated data. Some testing machines are equipped with an autographic attachment that draws the graph during the test. (The operator need not record any load or elongation readings except the maximum for each.) The coordinate axes of the graph are strain for the x-axis or scale of abscissae, and stress for the y-axis or scale of ordinates. The ordinate for each point plotted on the graph is found by dividing each of the tabulated loads by the original cross-sectional area of the sample; the corresponding abscissa of each point is found by dividing the increase in gage length by the original gage length. These two calculations are made as follows.
Stress and strain, as computed here, are sometimes called "engineering stress and strain." They are not true stress and strain, which can be computed on the basis of the area and the gage length that exist for each increment of load and deformation. For example, true strain is the natural log of the elongation (In (L/Lo), and true stress is P/A, where A is area. The latter values are usually used for scientific investigations, but the engineering values are useful for determining the loadcarrying values of a material. Below the elastic limit, engineering stress and true stress are almost identical. The graphic results, or stress-strain diagram, of a typical tension test for structural steel is shown in Figure 3. The ratio of stress to strain, or the gradient of the stress-strain graph, is called the Modulus of Elasticity or Elastic Modulus. The slope of the portion of the curve where stress is proportional to strain (between Points 1 and 2) is referred to as Young's Modulus and Hooke's Law applies. The following observations are illustrated in Figure 3:
Figure 3 Typical Ductile Material Stress-Strain Curve Hooke's Law applies between Points 1 and 2. Hooke's Law becomes questionable between Points 2 and 3 and strain increases more rapidly.
|
||
|
||
|
|
Integrated Publishing, Inc. - A (SDVOSB) Service Disabled Veteran Owned Small Business
|