|
||
|
|
||
|
Page Title:
Sketching and Labeling Contours |
||
| |||||||||||||||
|
|
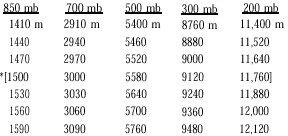
Click here to Order your Radar Equipment Online Sketching and Labeling Contours Contours are the upper-air equivalent of isobars on surface charts. They connect points of equal height on constant-pressure charts. The primary contours (isoheights) are spaced at 30-, 60-, and 120-meter intervals. The 30-meter interval is used on charts below 500 mb; the 60-meter interval, on charts between 500 and 300 mb; and the 120-meter interval, on charts at 300 mb and above. Primary contours are repre-sented by solid black lines. Some of the primary contours drawn on constant-pressure charts are as follows:*The bracketed contours are closest to the standard The above listing is not all inclusive; you may have to draw heights higher or lower than those listed. Intermediate contours may be used when greater definition is needed. They are one-half the primary contour interval for the level in question. For example, the primary contours on the 500-mb chart are drawn for every 60 meters. The intermediate contours would be drawn at 30-meter intervals. Intermediate contours are represented by dashed black lines. Contours should first be sketched lightly, using a black pencil, according to the reported heights and winds. Contours parallel the wind direction and are drawn following downwind, extrapolating between station height plots as necessary. The contours should conform to the
Figure 8-1-2.Example of an incorrectly plotted wind wind direction. However, since most plotters do not plot wind directions with the aid of a wind rose or protractor, wind directions tend to be the least reliable of the plotted data. Be aware of the tens digit plotted at the end of the wind shaft. It is not uncommon to see the plotted wind direc-tion differ from the reported value by as much as 20 degrees. For example, a 270 wind may get plotted anywhere from 250 to 290. See figure 8-1-2. While you are constructing the contour pat-tern, continually strive to accurately depict the wind field. Contour spacing is inversely propor-tional to wind speed. Only in areas of dense height reports where the winds are weaker (subgradient) or stronger (supergradient) than the gradient within which they appear is there any justifica-tion for drawing contours that do not conform to the reported wind. For stationary troughs and ridges, cyclonically curved contours are usually spaced more closely (tighter gradient) than anti-cyclonically curved contours of the same wind speed. Use geostrophic wind scales to aid in spac-ing contours in sparse-data areas.
Figure 8-1-3.Contour pattern between a high and a low
Figure 8-1-4.Contour pattern between adjacent highs and When you sketch preliminary contours, make smooth sweeping lines, bringing your entire arm into motion. Keep your eyes just ahead of the pen-cil. This will enable you to anticipate contour direction changes. Each contour will eventually form a loop or go off the chart. In no case do con-tours cross or touch contours of different values. The following discussion of rules for drawing contours is illustrated by figures 8-1-3 and 8-1-4. 1. Two contours of the same value will never exist between adjacent highs and lows. See figure 8-1-3. 2. There will always be two contours with the same value between two adjacent highs and two adjacent lows. See figure 8-1-4. 3. Adjacent contours of the same value will always flow in opposite directions. Some typical errors made by inexperienced analysts are illustrated in figure 8-1-5, to assist you in correctly drawing contours. Contours are labeled in decimeters. Use the thousands, hundreds, and tens digits. For example, the 3060-meter contour on the 700-mb chart is labeled 306. The units digit is dropped. On the
Upper-level contours form closed centers and |
|
Privacy Statement - Press Release - Copyright Information. - Contact Us - Support Integrated Publishing |