|
||
|
|
||
|
Page Title:
Unit 8 - Lesson 2 - Use of constant-pressure charts |
||
| |||||||||||||||
|
|
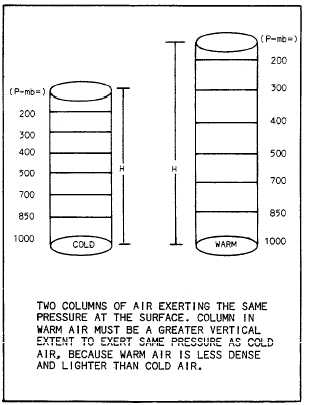
Click here to Order your Radar Equipment Online UNIT 8LESSON 2 USE OF CONSTANT-PRESSURE CHARTS OVERVIEW Identify the uses for the 1000-, 850-, 700-, 500-, 300-, 200-, 150-, 100-, 50-, and 25-mb constant-pressure charts.OUTLINE The 1000-mb chart The 850-mb chart The 700-mb chart The 500-mb chart The 300-mb chart The 200-mb chart The 150-, 100-, 50-, and 25-mb charts CONSTANT-PRESSURE CHARTS Upper-air charts are termed CONSTANT-PRESSURE CHARTS, because they depict conditions at levels (heights) within the atmosphere where the pressure is the same (constant).Constant-pressure charts are produced for standard levels. These levels are the 1,000-, 850-, 700-, 500-, 400-, 300-, 250-, 200-, 150-, 100-,70-, 50-, 30-, 20-, 10-, 7-, 5-, 3-, 2-, and 1-mb levels. However, the most commonly produced charts are for the 1000-, 850-, 700-, 500-, 300-, 200-, and 100-mb levels.Atmospheric soundings show that pressure changes most rapidly when the temperatures are cold and least rapidly when they are warm. Remember, pressure is a function of the weight of the atmosphere, and the atmospheres weight is dependent on its density. Cold air is more dense than warm air; therefore cold air is heavier and exerts more pressure at a given altitude. Assuming that two columns of air (one cold, one warm) exert the same pressure at the surface, the column containing the warm air has to extend to a greater height. Figure 8-2-1 illustrates the pressure-height differences in cold and warm air. Also, note the vertical spacing (thickness) between the constant-pressure levels.
Figure 8-2-1.Pressure-height differences in cold and warm As the temperatures in the atmosphere change, so do the heights of the constant-pressure levels. Based on the U.S. standard atmosphere, the approximate heights of the more common constant-pressure levels are as follows: Constant-pressure charts are primarily used as 1. Movements of weather systems 2. Areas of cyclonic and anticyclonic windflow 3. Types of air masses 4. Location of moist and dry areas within the atmosphere 5. Formation, intensification, and dissipation of pressure systems 6. Actual slopes of fronts 7. Vertical extent of pressure systems 8. Location and strength of jet streams Learning Objective: Identify the uses of constant-pressure charts commonly pre-pared and displayed in most weather offices.The following is a brief summary of the principal uses of constant-pressure charts commonly prepared and displayed in most weather offices. |
|
Privacy Statement - Press Release - Copyright Information. - Contact Us - Support Integrated Publishing |