|
||
|
|
||
|
Page Title:
Pressure tendency and net 3-hour change |
||
| |||||||||||||||
|
|
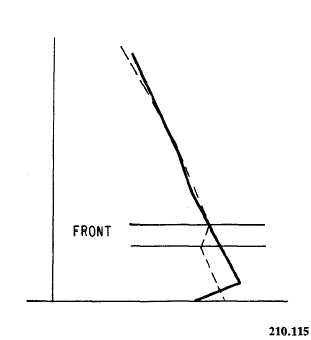
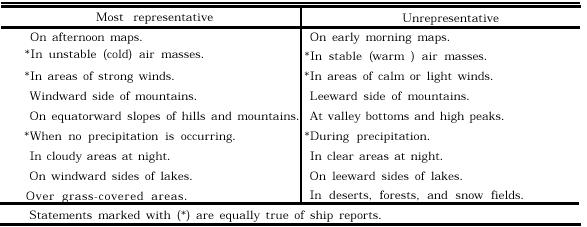
Click here to Order your Radar Equipment Online PRESSURE TENDENCY AND NET 3-HOUR CHANGE. Land stations report the most accurate 3-hourly changes in pressure, while some ships (especially USN) are subject to erratic course and speed variations which make pressure tendencies and net 3-hour changes seem inaccurate. The characteristic of the change in pressure and the amount of the change are important clues to developing weather situations. On a moving ship, pressure changes are due to the actual change in atmospheric pressure plus the change in pressure created by the ships movement in rela-tion to pressure systems. For example, a ship sail-ing eastward at 15 knots and being overtaken by a low-pressure system moving at 20 knots would show a slowly falling pressure characteristic. Another ship in the same area heading west at 20 knots would report rapidly falling pressure. Thus, two ships in the same area might actually report different pressure tendencies and changes. The course and speed of the ship and the movement of the pressure system must be known to correct apparent pressure change to true pressure change. TEMPERATURE. This element is more representative at sea than ashore, even though the temperatures reported by ships are about 1F higher than the actual free-air temperature. This is attributed to the heat of the ships themselves. The one area at sea where surface temperatures are not representative is in the vicinity of marked ocean currents. Surface temperatures rise or fall when passing over or near them. Over land, temperature is the least represent-ative of all elements reported. The reasons for this are many. Varying elevation is one which causes marked temperature differences: Being familiar with the geography of the region will help you in analyzing temperatures.Low-level or surface-based inversions will also cause some degree of unrepresentativeness; the stronger the inversion, the more unrepresentative the temperature. The most common causes of inversions are (1) nocturnal radiation, (2) drainage of cold air into valleys, (3) snow cover, (4) advec-tion over a colder surface, and (5) evaporation from a local body of water. All these processes are common on land, but only (4) and (5) apply at sea. A striking example of the nonrepresentative surface temperature occurs when the temperature rises following a cold frontal passage. This is a common occurrence over land when radiational cooling creates an inversion in advance of a cold front. A typical vertical temperature distribution in such a situation is shown in figure 7-1-1. The dashed line represents the postfrontal con-dition. "Because of the rising temperature follow-ing the frontal passage, this front is at times erroneously classified as a warm front. Another situation where temperature contrast across fronts is misleading is when there is little or no temperature contrast. At night, if the warm air mass is clear, or nearly so, and radiational cooling establishes a strong inversion, the cooler air beneath the inversion can become very char-acteristic of the air in the cold air mass. This situa-tion could lead you to believe the front has decreased in intensity, but in reality, this is not the case at all. Table 7-1-2 summarizes the relative unrepre-sentativeness of temperature under various 1conditions.DEW POINT. The dew-point temperature is representative whenever the air temperature is, and is often representative when air temperature is not. It is relatively unaffected by heating and cooling processes except those involving evaporation and condensation. At stations near a water source or wherever pre-cipitation is occurring, dew-point temperature will be unrepresentative; under most other conditions it is more representative than tem-perature and can often be used to find fronts where the temperature contrast is masked.
Figure 7-1-1.Illustration of a temperature rise with a Table 7-1-2.Surface
Temperature on Land Dew-point contrast is often the only means of Dew points reported by neighboring stations in the same air mass, but at different elevations, generally differ only slightly in comparison to air temperatures. This is because the dew-point temperature decreases with altitude at approx-imately one-fifth the rate of the decrease of air temperature. For the reasons outlined above, the dew-point temperature is one of the most reliable and useful elements of the surface report. |
|
Privacy Statement - Press Release - Copyright Information. - Contact Us - Support Integrated Publishing |