|
||
|
|
||
|
Page Title:
Synoptic characteristics of the pressure pattern |
||
| |||||||||||||||
|
|
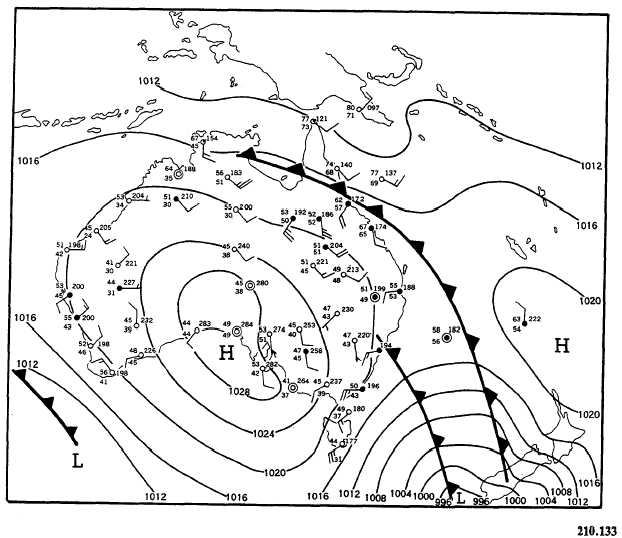
Click here to Order your Radar Equipment Online SYNOPTIC CHARACTERISTICS OF THE PRESSURE PATTERN Between the semipermanent highs are trains of warm migratory anticyclones. They move steadily at about 10 of longitude per day from west to east. Between these migratory highs are the upper parts of inverted V-shaped depres-sions that move along with them. These V-shaped depressions are the northern part of larger cyclonic systems to the south.APPLICATION OF SATELLITE CLOUD PHOTOGRAPHSThe application of satellite cloud photo-graphs to analysis (and forecasting) in the Southern Hemisphere is no different than in the Northern Hemisphere. However, because of a lack of surface synoptic reports, the use of satellite data is a must. You must bear in mind, however, that the orientation of the cloud systems in relation to the meteoro-logical features must be adjusted according to the reverse flow. APPLICATION OF COMPUTER PRODUCTS As mentioned earlier, computer products are frequently used in place of the hand-T his practice is rapidly becoming standard procedure and is even more applicable to the Southern Hemisphere because of the scarcity of data. The AG must learn as much as he can about the application and interpretation of computer products in analysis and forecasting. SYNOPTIC ANALYSIS Basically, the techniques of Southern Hemisphere analysis do not differ appreciably from those of its Northern Hemisphere counter-part. Certain aspects, however, must be emphasized.1. Since the Southern Hemisphere is largely made up of water, oceanic analysis is of greater importance.2. Satellite imagery is extremely valuable because of the lack of weather reporting stations. The Falkland Islands War of 1982 served to dramatically highlight its importance. Weather reports in this area of the South Atlantic became almost totally nonexistent and severely hampered the British Admiraltys operational planning efforts.3. Wind and pressure observations from ships are not overly abundant, and, therefore, are extremely important. They should be used in conjunction with geostrophic wind scales to get as representative a pressure pattern as possible over water areas.4. Knowledge of terrain and topographical characteristics is important when considering the representativeness of island and other land reports and in drawing the pressure pattern. The higher elevations of the South African plateau, the Andes of South America, and to a lesser ex-tent, the islands of New Zealand often create very distorted isobaric patterns. No attempt should be made to connect the pressure patterns between these continental and adjacent ocean areas. In fact, wherever terrain heights differ by 5,000 feet or more, refrain from connecting them. Any orographic distortion of isobars is greater in stable air masses. Figure 7-5-1 shows a typical analysis in the region of Australia.5. Make extensive use of computer products and available satellite data.PRACTICAL TRAINING EXERCISE This practical training exercise involves actual analysis with real-time data. If you have done the suggested practical training publications, you should have little difficulty with your first real analysis.
If surface analyses are routinely done in your Assuming you have a plotted surface chart with all past history and the previous surface analysis has been checked for accuracy, use the following procedure: 1. Lightly sketch in all fronts, isobars, pressure centers, and air-mass identification. 2. Have the duty forecaster check over your work for accuracy, frontal placement, etc. Also, have him show you how and when to draw in-termediate isobars. 3. Wait, if necessary, for the computer analysis that matches the date/time of your analysis. Compare your analysis with that of the computer analysis and satellite pictures that are valid at or near your chart time. 4. Make any final adjustments that you feel are needed. Have the duty forecaster make a final check of your analysis. If everything is correct, harden in the chart using the appropriate colors and symbols. Remember, neatness is important. 5. Erase the pencil marks on the chart. You are now ready to do a weather isallobar analysis. Have this checked upon completion. 6. Determine the direction and speed of move-ment of all migratory systems. 7. Hangup your analysis; stand back about 12 feet and carefully look it over. Make a mental note of everything you do not like about it, and try to correct deficiencies as you progress in your training. To gain proficiency in analysis, you must make every effort to do at least one analysis per watch. True analysis is a detailed study of the state of the atmosphere based on actual observations, and includes understanding what is happening and why. References Aerographers Mate 1 & C, NAVEDTRA 10362-B1, Naval Education and Training Program Development Center, Pensacola, Fla., 1974.Aerographers Mate 3 & 2, NAVEDTRA 10363-E1, Naval Education and Training Program Development Center, Pensacola, Fla., 1976.A Collection and Evaluation of Weather Forecasting Rules, U.S. Navy Post Graduate School, Annapolis, Md., 1953, American Meteorological Society, Glossary of Meteorology, NAVEDTRA 40502, Naval Education and Training Support Center, Pacific, 1978. General Meteorology, NA50-1B-5 15, New York, 1974.Handbook of Meteorology, NAVAER 50-110R-42, New York, 1945. U.S. Department of Transportation, Guard, 1979.World Meteorological Organization, Guide on the Global Data-Processing System, WMO Bulletin No. 305, Geneva, Switzerland, 1971.
|
|
Privacy Statement - Press Release - Copyright Information. - Contact Us - Support Integrated Publishing |