|
||
|
|
||
|
Page Title:
Unit 7 - Lesson 4 - Finalizing the analysis |
||
| |||||||||||||||
|
|
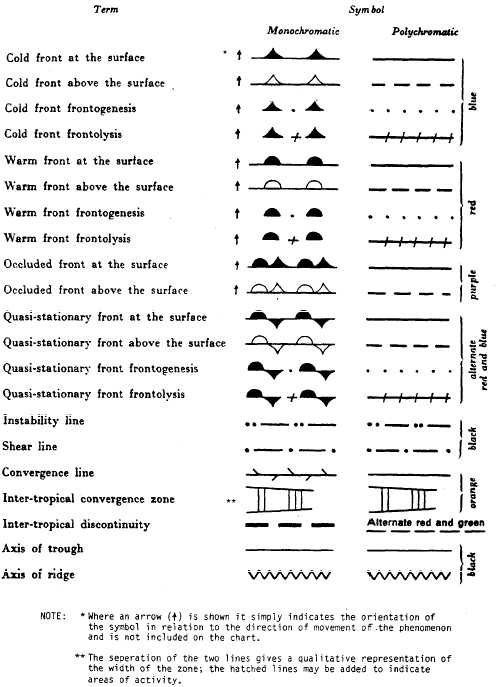
Click here to Order your Radar Equipment Online UNIT 7LESSON 4 FINALIZING THE ANALYSIS OVERVIEW Identify the correct procedures for labeling the various features of an analyzed surface chart. Identify the procedures for depicting and ana- lyzing movement, air masses, precipitation and obstructions to vision, and isallobars.OUTLINE Fronts Isobar labeling High and low centers Tropical cyclones Additional analysis considerations Movement analysis Air-mass analysis Weather analysis Isallobaric analysis FINALIZING THE ANALYSIS After the isobars and fronts have been sketched on the surface chart, it is time to com-plete the analysis. This consists of hardening in the chart with the appropriate colors, symbols, codes, and shading. To what extent this is done will vary with each command.The requirement for additional analyses is normally based on command requirements of interpretation, forecasting, and briefing. The objective of your finished product is a chart that is highly representative, neat, and easy to read. A chart that attempts to show too much infor-mation is confusing and actually detracts from the professional picture you are trying to convey.Learning Objective: Identify the correct procedures for labeling the various features of an analyzed surface chart.FRONTS Color in fronts, using felt-tip markers. Stand-ard symbols are shown in figure 7-4-1. The normal practice by the Naval Oceanography Command is to use a combination of weather analyses, monochromatic symbols, and colors. This enhances the visual effect of the final analysis. After the fronts are colored, indicate areas of frontogenesis and frontolysis, if applicable.ISOBARS Harden in the isobars with a medium point black felt pen. Use the following guidelines.1. Do not try to trace your pencil lines exactly. Doing this results in rough, irregular lines. Instead, maintain a smooth, consistent flow. If you deviate slightly from the pencil lines, it will have little effect on the charts overall accuracy.
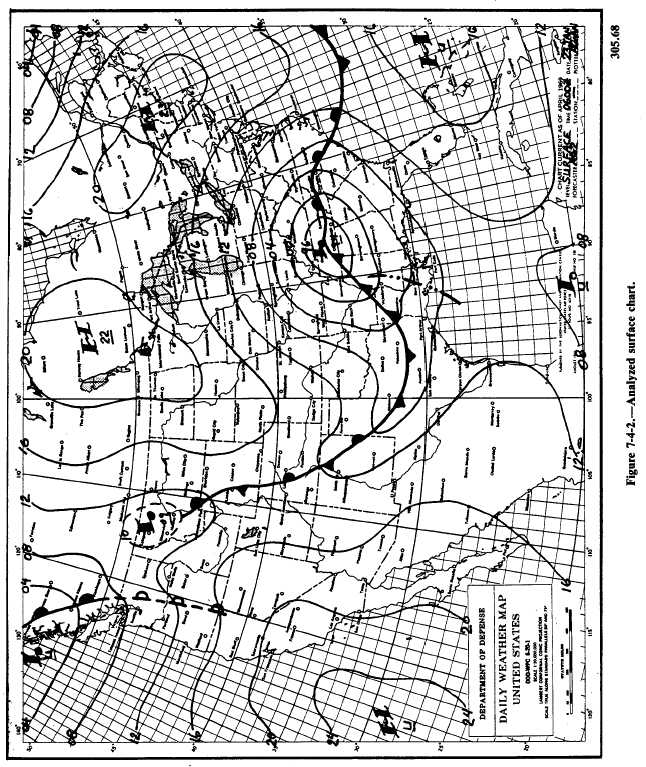
3. When tracing isobars that go from one end 4. When tracing closed isobars, leave a space at the top of the closed pressure centers for isobar labeling. Figure 7-4-2 shows an example of a finished surface chart. |
|
Privacy Statement - Press Release - Copyright Information. - Contact Us - Support Integrated Publishing |