|
||
|
|
||
| |||||||||||||||
|
|
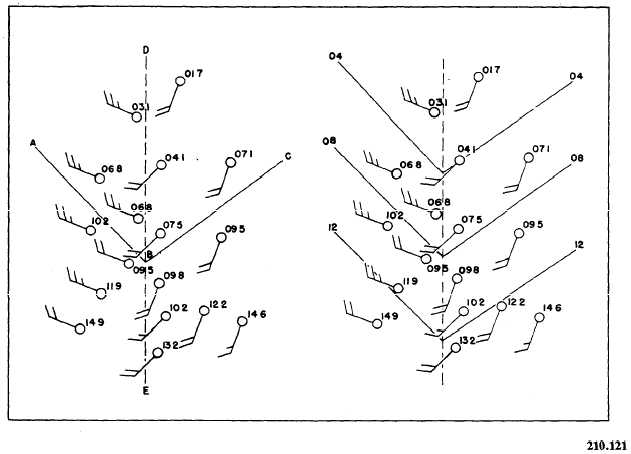
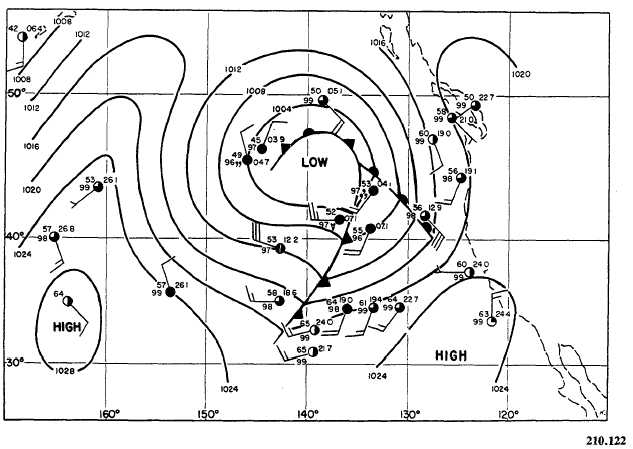
Click here to Order your Radar Equipment Online Quasi-Stationary Fronts When the past history is accurate, quasi-stationary fronts are easily located. Merely look for them in the same general vicinity as on the previous maps. A previously quasi-stationary front that has moved a considerable distance should be reclassified according to its movement and labeled cold or warm, as appropriate. The weather along quasi-stationary fronts is usually a mixture of cold and warm frontal weather. Often there is no weather along the front and little difference in temperature and dew point across it. Pressure changes across these fronts are small, and the characteristic of the barograph trace is indefinite. The associated wind shift is usually small also. Isobars do not often form a well-defined trough; nevertheless, they do kink at the front toward higher pressure. The best in-dicator of the quasi-stationary front is the cloud deck. If theres little difference from past history, it is usually a good indication that the quasi-stationary front still exists.As you can see, youll be studying many sta-tion reports, past and current, to locate and deter-mine the movement of fronts. Examine all reports in detail to determine the types of fronts present and their characteristics. Isobaric Relationship One of the best indicators of frontal location on surface charts is the kink of the isobars at fronts. The amount of kink is governed by the strength of the front, its movement, and its par-ticular stage of development. The kink always points toward higher pressure (see fig. 7-3-1). For example, suppose you start to draw the 1008 isobar in figure 7-3-1. Drawing downwind in proper relation to the sea level pressure reports, you come to observation point B. Note that the next observation downstream shows a change in the wind. To follow the wind, you must now draw the isobar toward point C. It is evident that there is a discontinuity y, or front, along the dashed line D to E. Thinking of the isobar as an arrowhead at the point of intersection with the front, note it points towards higher pressure.REMEMBER: Wind reports from ships are more representative than the pressure reports. Figure 7-3-2 shows the location of fronts in a cyclonic system approaching the West Coast. The fronts in this situation are clearly identified by the reports.Stationary and Nonfrontal Troughs Stationary troughs can contain fronts only momentarily. The most common such trough in North America occurs on the leeward (east) side of the Continental Divide. Unless the air mass fol-lowing the front is dense enough to fill the trough, a front moving eastward across the Rocky Moun-tains may occupy this trough at a particular map time but will move on through while the trough remains fixed. Needless to say, warm fronts mov-ing through such a trough will not affect its sta-tionary character. These troughs occur on the lee side of mountain ranges and are known as lee side troughs. On the windward side, the winds are deep and strong and blow perpendicular to the range. Another kind of stationary trough occurs in the southwestern United States and is most pro-nounced in the summer. It sometimes extends the full length of the West Coast.The most common nonfrontal troughs in middle latitude ocean areas occur in the wake of well-developed occluded cyclones. (They also occur over land areas.) These troughs are often incorrectly analyzed as secondary cold fronts, because they have well-defined lines of showers, cumuliform clouds, wind changes, and pressure
Figure 7-3-1.Isobaric discontinuity at a front. The illustration on the
left shows an isobar drawn downwind from A. A
tendencies across the trough line similar to those |
|
Privacy Statement - Press Release - Copyright Information. - Contact Us - Support Integrated Publishing |