Custom Search
|
|
  |
|
|
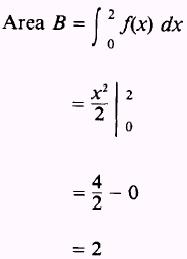
SOLUTION: Substituting into equation (6.7), we have
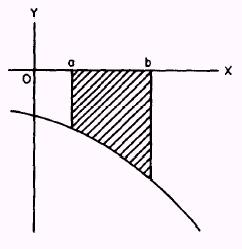
The area above a curve and below the X axis, as shown in
figure 6-11, will, through integration, furnish a negatvie answer.
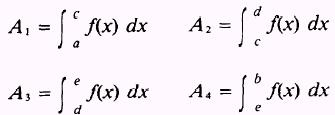
Figure 6-11.-Area above a curve. If the graph of y = f(x), between x = a and x = b, has
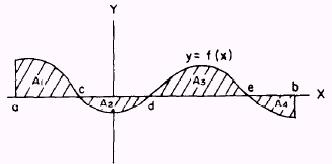
portions above and portions below the X axis, as shown in figure 6-12, then
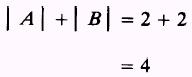
is the sum of the absolute values of the positive areas
above the X axis and the negative areas below the X axis, such that
where
Figure 6-12.-Areas above and below a curve.
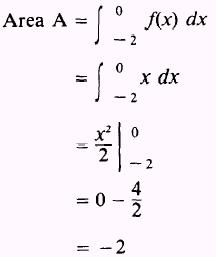
EXAMPLE: Find the areas between the curve y=x and the X axis bounded by the lines x= -2 and x=2 as shown in figure 6-13.
Figure 6-13.-Negative and positive value areas. SOLUTION. These areas must therefore, we write be computed
separately;
and the absolute value of - 2 is
Then,
Adding the two areas,
NOTE: If the function is integrated from - 2 to 2, the
following INCORRECT result will occur:
This is obviously not the area shown in figure 6-13. Such
an example emphasizes the value of making a commonsense check on every solution. A sketch of
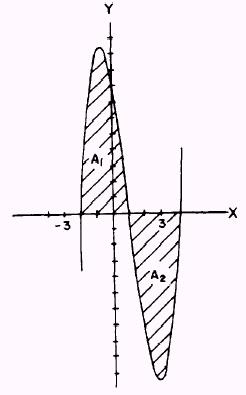
the function will aid this commonsense judgement. EXAMPLE: Find the total area bounded by the curve
the
X axis, and the lines x=
-2 and x=4 as
shown in figure 6-14. SOLUTION. The area desired is both above and below the X axis;
therefore, we need to find the areas separately and then add them together
using their absolute values.
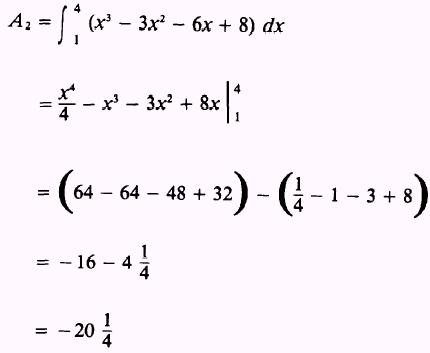
Figure 6-14.-Positive and negative value areas. Therefore,
and
Then, the total area is
|
 
|