Custom Search
|
|
 
|
||
|
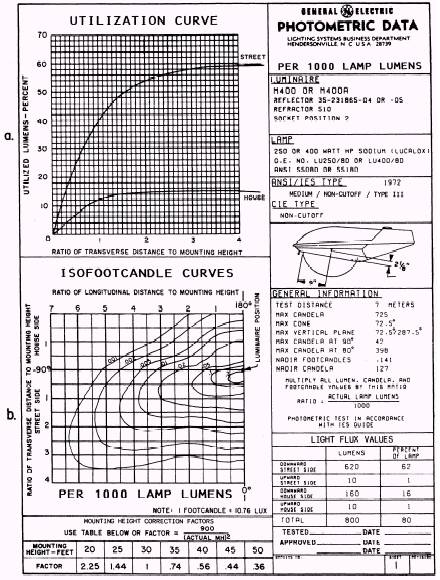
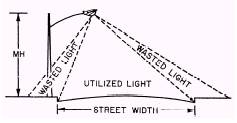
MANUFACTURER'S LITERATURE The performance specifications of each model, type, and size of luminaire are provided with the fixture or obtained from the manufacturer's ordering information. A working knowledge of this information will assist you in selecting and installing the correct luminaire to accomplish the job. Figure 1-12 is the manufacturer's literature provided with a General Electric, 250- or 400-watt, LucaloxR streetlight. Utilization Curve The utilization curve (fig. 1-12a), a measure of luminaire efficiency, shows the amount of light that falls on the roadway and adjacent areas. The amount of light that is usable or actually falls on the area to be lighted is plotted as a percentage of the total light generated within the luminaire for various ratios of transverse distance (across the street from the luminaire on both the house side and street side) to the mounting height
Figure 1-12.\Streetlight manufacturer's literature. (see fig. 1-13). The coefficient of utilization for any specific situation is obtained from this curve. The utilization curve will determine the amount of light that actually strikes the roadway surface. This percentage of light has an impact on the spacing distance of the luminaires. Isofootcandle Curves The isofootcandle diagram (fig. 1-12b) shows the distribution of illumination on the road surface in the vicinity of the luminaire. The lines on this diagram connect all points having equal illumination, much as the contour lines on a topographical map indicate all points having the same elevation. Thus at any point on the diagram (or roadway) we know the magnitude and direction, with respect to nearby points. To make this data more universal, both the top horizontal and left vertical axes are given in terms of mounting-height ratios. It is sometimes convenient for you to replot the isofootcandle data to the same scale as that used on a drawing containing a lighting layout. By superimposing this diagram, you can study the distribution of light. Under the unity correction factor in the mounting-height table, one can find the mounting height for which the data are calculated. The numbers beside each line represent the initial footcandle values per 1,000 lamp lumens. For instance, the GE, 400-watt, LucaloxR lamp produces 50,000 lumens. Each footcandle value must be multiplied by 50 to obtain the correct footcandle value on the isofootcandle diagram. This ratio of actual lamp lumens divided by 1,000 is known as the lamp factor (LF). Note that this allows a curve to represent the distribution from more than one lamp wattage; for example, from 250- and 400-watt LucaloxR lamps.
Figure 1-13.\Luminaire utilization. Maintenance Factor Lighting efficiency is seriously impaired by blackened lamps, by lamp life, and by dirt on the reflecting surfaces of the luminaire. To compensate for the gradual loss of illumination, a maintenance factor (MF) must be applied to the lighting calculations. Normally, each luminaire manufacturer can supply you with the maintenance factor for your lamp model. However, when the manufacturer's information is not available, a 0.70 maintenance factor is widely used in the industry. |
 
|
|
|
||