 |
||
|
|
||
| |||||||||||||||
|
|
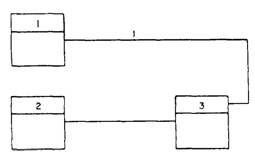
PRECEDENCE DIAGRAMING Network procedures are based upon a system that identifies and schedules key events into precedence-related patterns. Since the events are interdependent, proper arrangement helps in monitoring the independent activities and in evaluating project progress. The basic concept is known as the critical path method (CPM). Because the CPM places great emphasis upon task accomplishment, a means of activity identification must be established to track the progress of an activity. The method currently in use is the activity-on-node precedence diagraming method (PDM), where a node is simply the graphic representation of an activity. An example of this is shown in figure 9-8. Precedence diagraming does not require the use of dummy activities. It is also easier to draw, and has greater applications and advantages when networks are put in the computer. In precedence diagrams, the activity is "on the node." Activities and Events To build a flexible CPM network, the manager needs a reliable means of obtaining project data to be represented by a node. An activity in a precedence diagram is represented by a rectangular box and identified by an activity number. The left side of the activity box represents the start of the activity. The right side represents the
Figure 9-8.-Precedence diagram. completion. Lines linking the boxes are called connectors. The general direction of flow is evident in the connectors themselves. Activities may be divided into three distinct groups: 1. Working activities-Activities that relate to particular tasks; 2. Milestone events-Intermediate goals with no time duration, but that require completion of prior events before the project can proceed; and 3. Critical activities-Activities that, together, comprise the longest path through the network. This is represented by a heavy- or hash-marked line. The activities are logically sequenced to show the activity flow for the project. The activity flow can be determined by answering the following questions: What activities must precede the activity being examined? What activities can be concurrent with this activity? What activities must follow this activity? WORKING ACTIVITIES.- With respect to a given activity, these representations indicate points in time for the associated activities. Although the boxes in the precedence diagram represent activities, they do not represent time and, therefore, are not normally drawn to scale. They only reflect the logical sequence of events. MILESTONE EVENTS.- The network may also contain certain precise, definable points in time, called events. Examples of events are the start and finish of the project as a whole. Events have no duration and are represented by oval boxes in a network, as shown in figure 9-8. Milestones are intermediate goals within a network. For instance, "ready for print" is an important event that represents a point in time but has no time duration of its own. To reach this particular activity, all activities leading up to it must be completed. CRITICAL ACTIVITIES.- A critical activity is an activity within the network that has zero float time. The critical activities of a network make up the longest path through the network (critical path) that controls the project finish date. Slashes drawn through an activity connector, as shown in figure 9-9, denote a critical path.
Figure 9-9.-Designations of a critical path. The rule governing the drawing of a network is that the start of an activity must be linked to the ends of all completed activities before that start may take place. Activities taking place at the same time are not linked in any way. In figure 9-8, both Activity 2 and Activity 3 start as soon as Activity 1 is complete. Activity 4 requires the completion of both Activities 2 and 3 before it may start. Use of Diagram Connectors Within a precedence diagram, connectors are lines drawn between two or more activities to establish logic sequence. In the next paragraphs, we will look at the diagram connectors commonly used in the NCFs. REPRESENTING A DELAY.- In certain cases, there may be a delay between the start of one activity and the start of another. In this case, the delay maybe indicated on the connector itself, preceded by the letter d as in figure 9-10. Here, Activity 2 may start as soon as Activity 1 is complete, but Activity 3 must wait 2 days. The delay is stated in the basic time units of the project, so the word "days" can be omitted. REPRESENTING A PARALLEL ACTIVITY.- Some activities may parallel others. This can be achieved in precedence diagrams without increasing the number of activities. For instance, it is possible to start laying a long pipeline before the excavations are completed. This type of overlap is known as a lead. It is also possible to start a job independently, but to not complete it before another is
Figure 9-10.-Representation of delay.
Figure 9-11.-Lead on start of a preceeding activity. completed. This type of overlap is known as a lag. It is also a common occurrence that both the start and the finish of two activities maybe linked, but, in this case, they are accommodated by a combination of lead and lag. As seen in figure 9-11, a lead (or partial start) is indicated by drawing the connector from the start of the preceding activity (1). In figure 9-12, a lag (or partial finish) is indicated by drawing the connector from the end of the following activity (3). The values may be given in the basic time units of the project, as with a delay, or as a percentage of overlap. In certain circumstances, they can be stated as quantities if the performance of the activity can be measured on a quantitative basis. The indication of the type and amount of delay, lead, or lag is generally referred to as a "lag factor." In figure 9-11, Activity 3 may start when Activity 1 is 1-day completed, although Activity 2 must wait for the final completion of Activity 1. In figure 9-12, Activity 3 may start when Activity 2 is completed but will still have 1 day to go when Activity 1 is completed. The last phase of Activity 3 may not begin until Activity 1 has been completed. In figure 9-13, Activity 2 may start when Activity 1 is
Figure 9-12.-Lag on finish a of following activity.
Figure 9-13.-Start and finish lags on same activity. advanced 3 days but will still have 4 days of work left when Activity 1 is completed. SPLITTING CONNECTORS.- The number of sequencing connectors becomes large when a net work is of a great size. When two activities are remote from each other and have to be connected, the lines tend to become lost or difficult to follow. In such cases, it is not necessary to draw a continuous line between the two activities. Their relationship is shown by circles with the following-activity number in one and the preceding-activity number in the other. In figure 9-14, both Activities 2 and 6 are dependent upon Activity 1. DIRECT LINKING USING AN EVENT.When the number of common preceding and succeeding activities in a particular complex is large, as in figure 9-15, a dummy event or focal activity of zero duration may be introduced to simplify the network. The use of such a dummy event is shown in figure 9-16, which is a simplification of figure 9-15. Although the effect in terms of scheduling is the same, the introduction of the dummy improves the clarity of the diagram. JOINING CONNECTORS.- In many instances, there are opportunities to join several
Figure 9-14.-Splitting connectors.
Figure 9-15.-Multiple predecessors and successors (direct linking).
Figure 9-16.-Multiple predecessors and successors (using dummy collector). connectors going to a common point to reduce congestion in the drawing. This practice is, however, discouraged. The diagrams in figures 9-17 and 9-18 have precisely the same interpretation. The danger with
Figure 9-17.-Direct representation of dependencies.
Figure 9-18.-Indirect linking of dependencies. the form of representation is evident in figure 9-18, where several connectors have been joined. When the network is coded for the computer, you may lose sight of the fact that Activity D has three preceding activities since only one line actually enters Activity D. |
|
Privacy Statement - Press Release - Copyright Information. - Contact Us - Support Integrated Publishing |